The Shape of Song


© Martin Wattenberg
Martin Wattenberg (b. 1970) is an American artist and scientific researcher who creates visual treatments of culturally significant data.[1] Best known for creating interactive data visualizations, Wattenberg is especially sensitive to the dialectic potential of information displays. His early works figured significantly in establishing the genre of artistic information visualizations, which in the meantime have become quite common. In 2001, with the help of a commission from Turbulence.org, Wattenberg turned his attention to visualizing the structure of music through his project The Shape of Song.[2] Many audiovisual software artists have attempted to visualize music with the help of real-time graphics; Wattenberg, on the other hand, has approached the problem as one of notation and produced a project that develops a new form of static image revealing hidden patterns latent in the music’s score. Indeed, The Shape of Song is necessarily a non-real-time visualization of music, as any real-time version would require perfect future knowledge.
The Shape of Song is specifically designed to reveal repetitions of musical passages within MIDI files. The project takes the form of an online Java applet, within which visitors can select a preloaded musical composition (e.g., Bach, the Beatles, Britney Spears) or upload a MIDI file of their own for visualization. Wattenberg explains the straightforward method as follows:
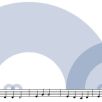
The diagrams in The Shape of Song display musical form as a sequence of translucent arches. Each arch connects two repeated, identical passages of a composition. By using repeated passages as signposts, the diagram illustrates the deep structure of the composition. For example, the picture above was built from the first line of a very simple piece, "Mary Had a Little Lamb.” Each arch connects two identical passages. To clarify the connection between the visualization and the song, in this diagram the score is displayed beneath the arches … . The resulting images reflect the full range of musical forms, from the deep structure of Bach to the crystalline beauty of Philip Glass. [3]
In a software landscape heavily populated by real-time displays of pitch, loudness, and other instantaneous auditory features, The Shape of Song continues to be a significant approach to music visualization because of its ability to represent long-scale and multiscale temporal structures in music. Since the project’s launch in 2001, Wattenberg’s Arc Diagram visualization method has been particularly influential in the broader field of information visualization as well, finding new uses in projects for visualizing such diverse datasets as Internet chatting behavior, hypertext links between blogs, biblical cross-references, and campaign contributions.[4]
- original Title: The Shape of Song
- Date: 2001
- Genre: Audio/visual installation, Software